Application Tracing
Enabling Tracing
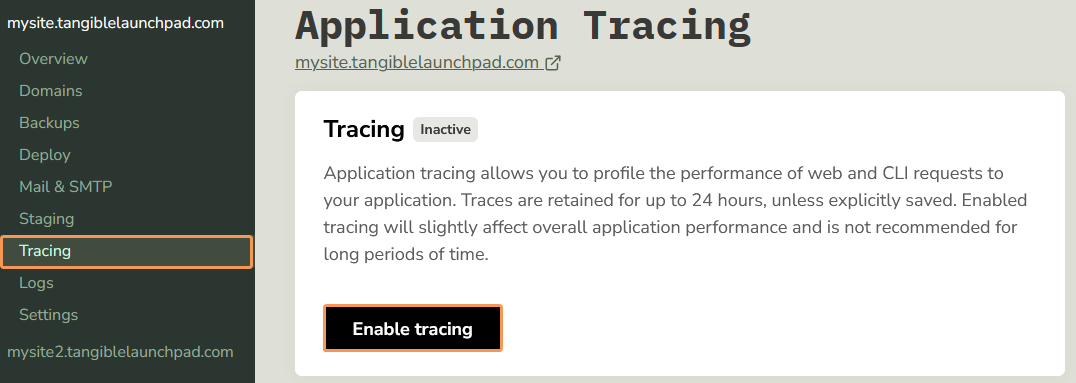
To enable application tracing, navigate to the "Tracing" tab in the sidebar under your application and click "Enable Tracing":

Be aware that tracing inherently impacts overall application performance, so it's usually not recommended (or necessary) to keep it enabled for longer than it takes to record the specific transactions you're interested in.
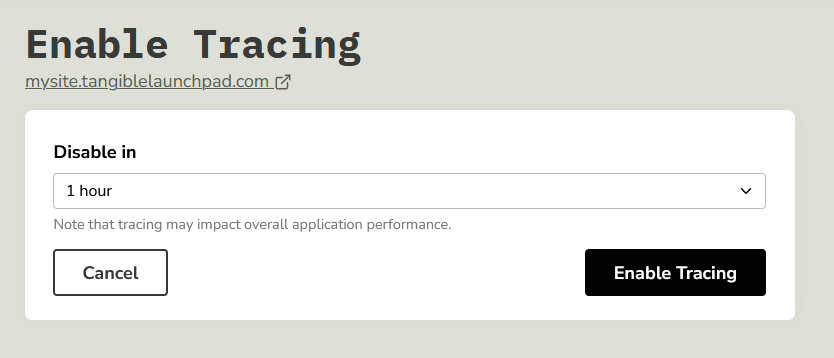
For this reason, after enabling tracing, you will be prompted to select a timeframe after which it will disable itself automatically:

Go ahead and either visit the applicable pages, or make requests to the server that you're looking to trace. Alternatively you can wait for traffic to come through organically.
Traces Table
Once transactions come through, you should be able to see the individual traces listed in a filterable view. Along with each trace you'll be able to see the request type, request path, response code, transaction duration (in milliseconds), peak memory used (in MiB), date/time of the request, and a button to view more information:

You can also filter the traces by the request path by typing a path into the "Filter expression" bar. Also note the example expression below for more options:

You can include extra filters like status:200 or method:post, for example.
Drilling Down
If you click "View" on a specific trace that you're interested in, you'll see more information about that specific transaction. At the top you'll see the information from the table before but a bit more expanded:

Below that you'll see a breakdown of the most time consuming functions which you can also drill down into by clicking the function name:

The "Self" column refers to how long in milliseconds the function took inside of itself (not including other functions called within it), and the "Total" column refers to how long the function took to run as a whole (including all sub-functions).
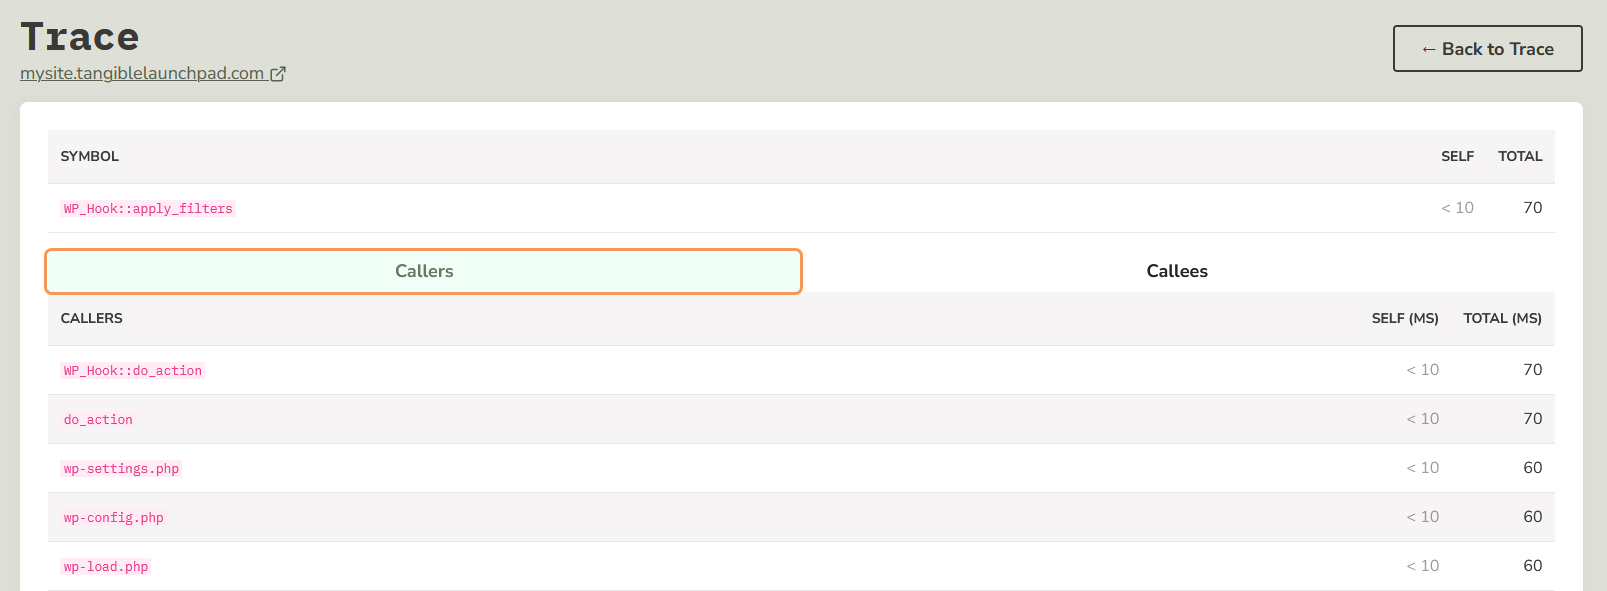
By drilling down into a specific function further, you're able to see what exactly is responsible for calling that function under the Callers tab:

You can also see the functions that it calls under the Callees tab next to it.